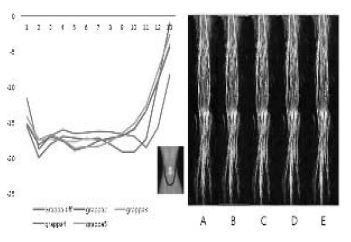
Fig. 3. Center of ROI velocity graph and streamline image per Grappa (A:off, B:G1, C:G2, D:G3, E:G4)